Teads Summer School
Movie App
Overview
A full-stack movie discovery and playlist management application built during the Teads Summer School — covering frontend, backend, database design, and a complete production-grade observability stack.
Role
Full Stack Developer
DevOps / Infra
Type
Summer School Project
Solo Development
Year
2025
Status
Completed
Frontend
A modern Angular interface for movie discovery
The frontend is built with Angular 20 and Angular Material, providing a clean and responsive interface for browsing, searching, and organizing movies. State is managed with Angular Signals — the framework's modern reactive primitive — rather than the traditional RxJS observable approach.
Routes cover the full user journey: home, browse, search, individual movie detail pages, and a complete playlist management interface with per-playlist views.
Movie Discovery & Browsing
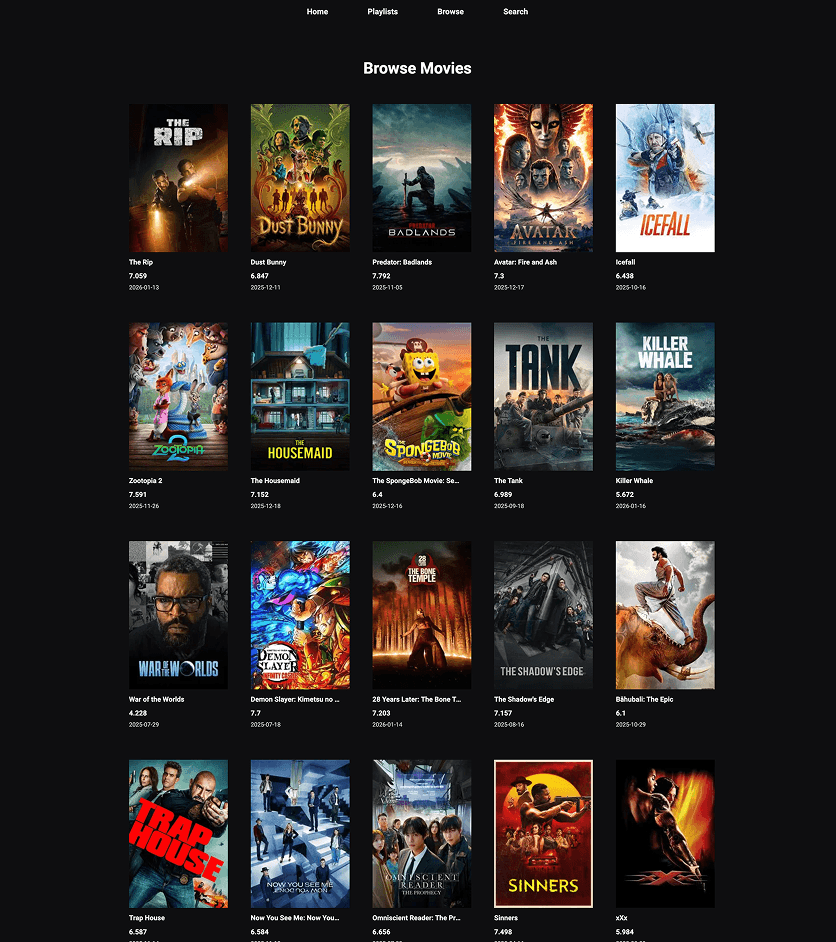
A home and browse view pulls popular movies from the backend, which proxies TMDB. The Angular Material layout is fully responsive — optimized for both desktop and mobile viewports.
Real-time Search
Title-based search queries the backend live as users type. Results are streamed through Angular's HttpClient and rendered reactively without full page reloads.
Movie Detail View
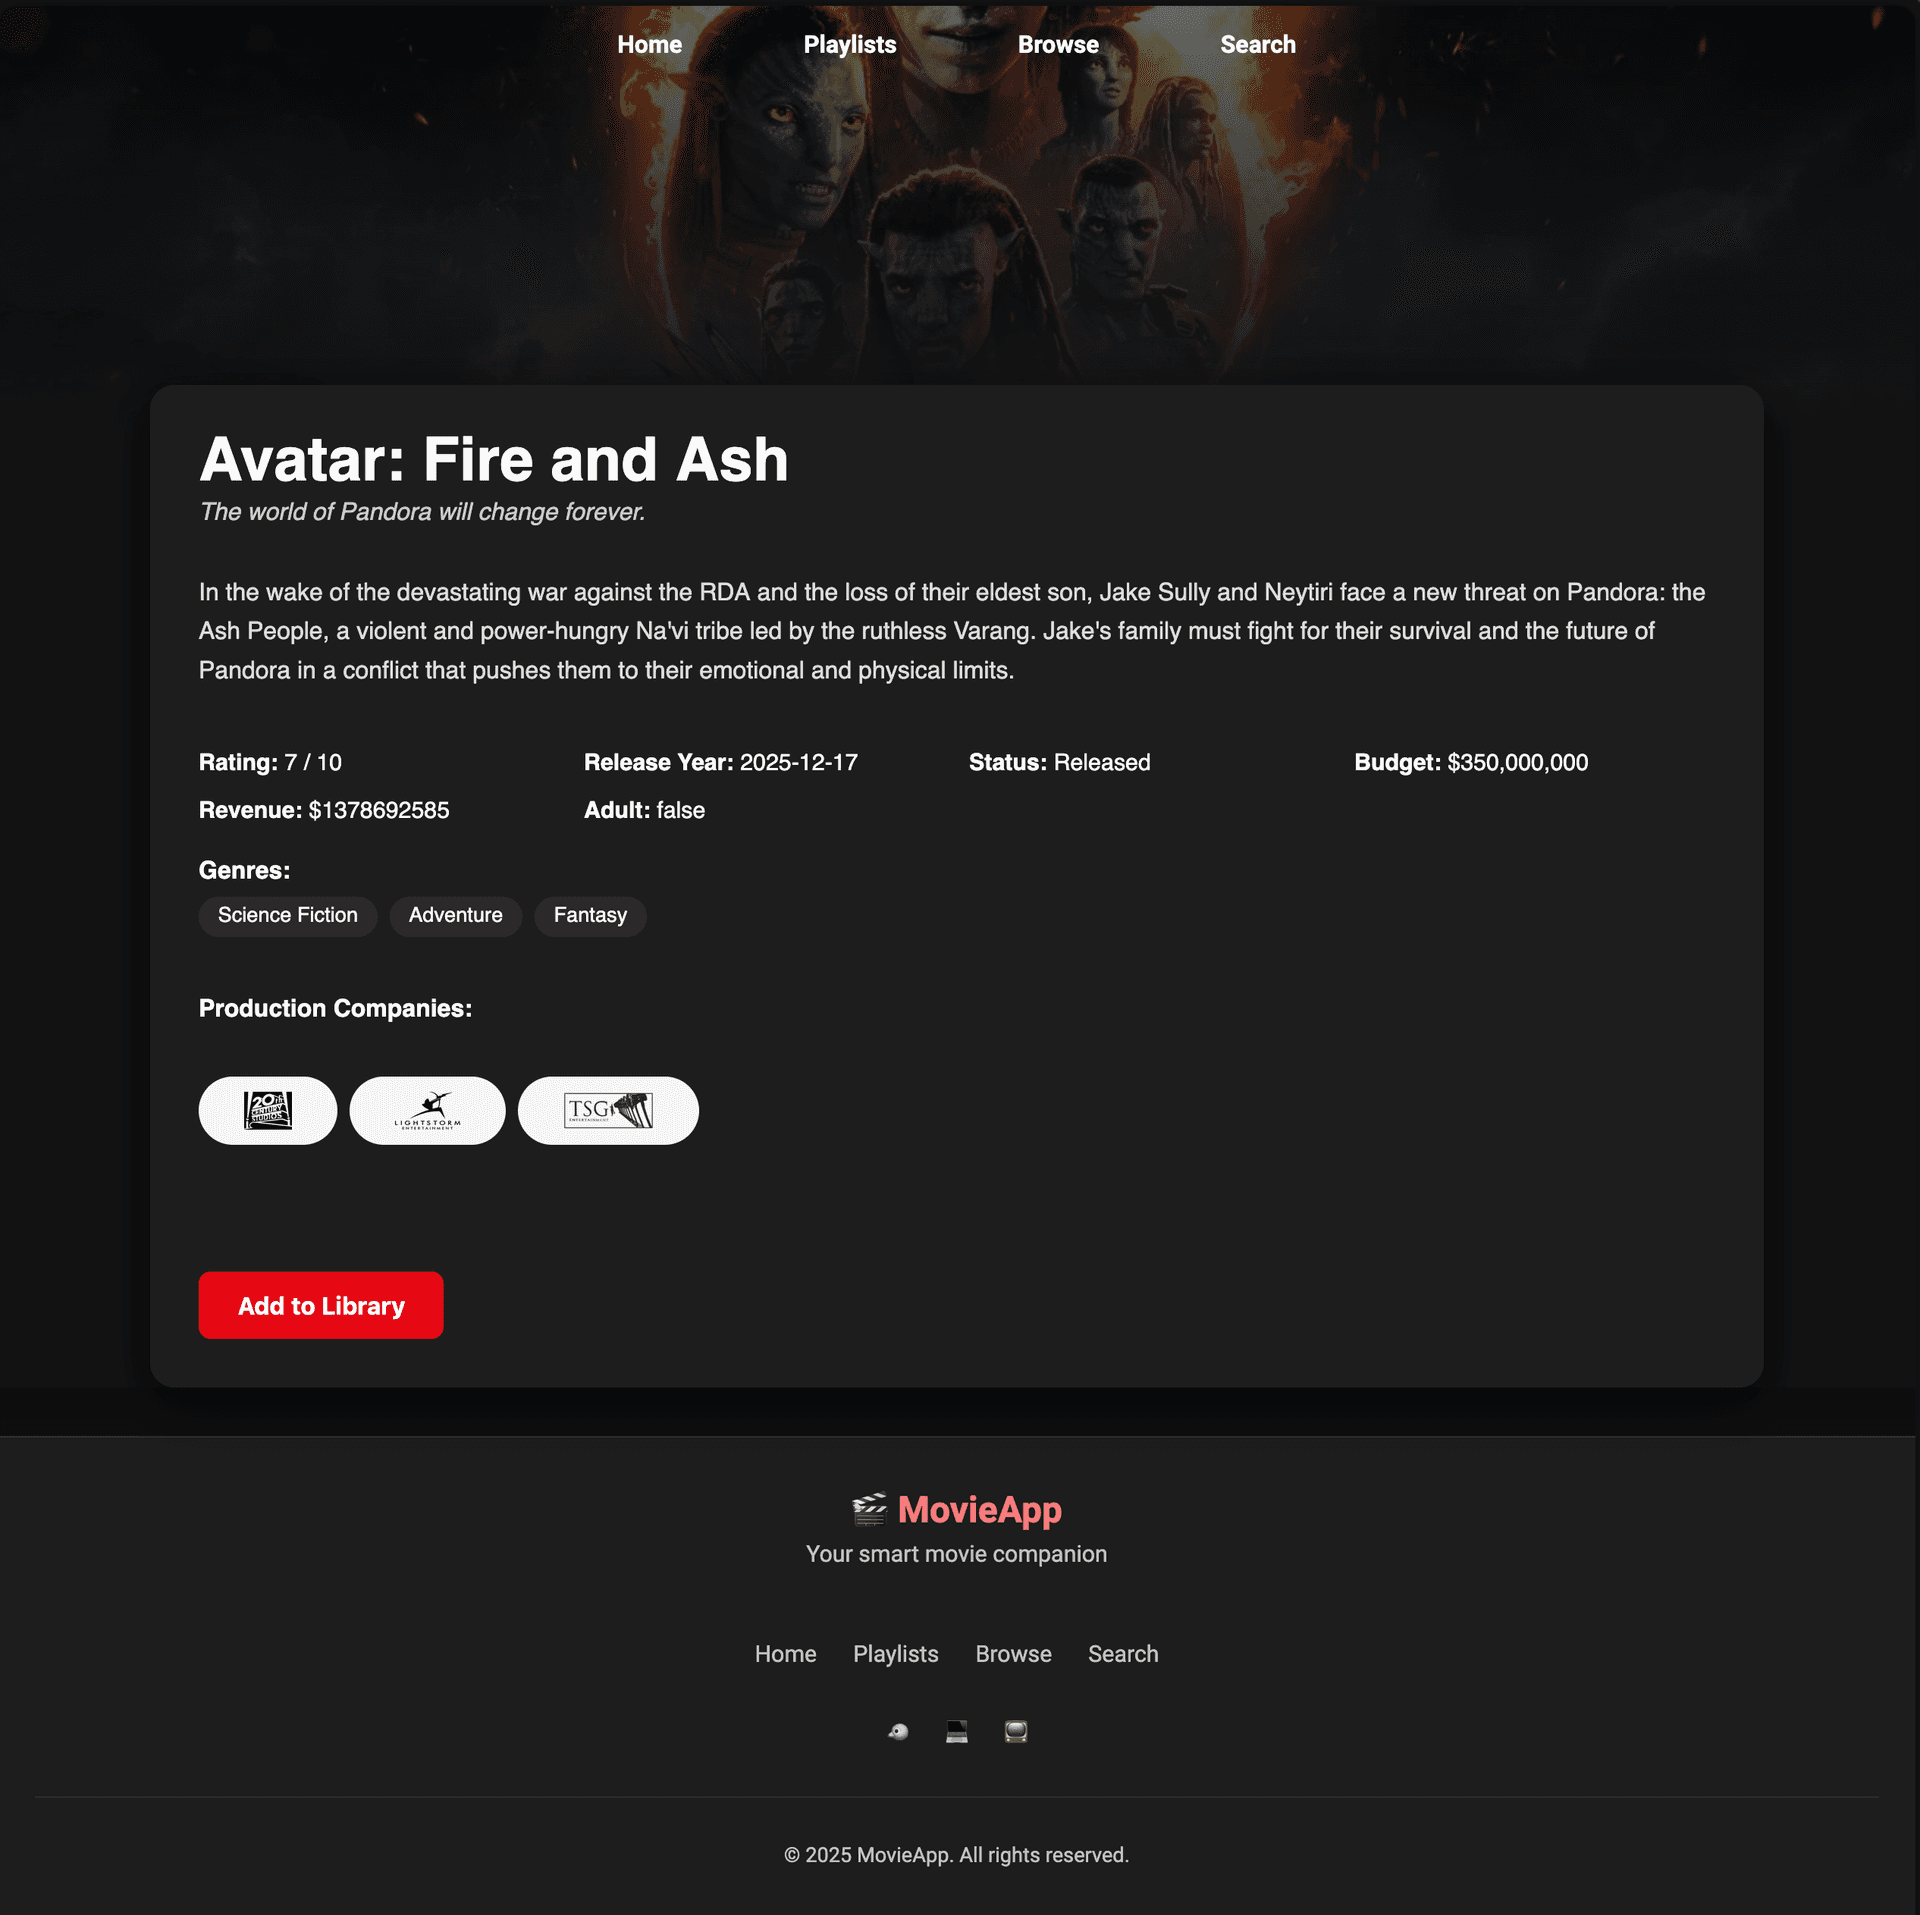
Each film has a dedicated detail page surfacing release date, genres, budget, revenue, audience rating, synopsis, available trailers, and streaming provider availability — all fetched from the backend in a single view.
Custom Playlists
Users can create named collections and add movies to them. Playlists are persisted to PostgreSQL through the REST API, so collections survive page refreshes and sessions.
Angular Signals
State is managed with Angular's modern Signals API instead of traditional RxJS observables, resulting in simpler, more predictable reactivity and fewer subscription lifecycle issues.
Framework
- Angular 20.1
- TypeScript
- Angular CLI
UI
- Angular Material
- Responsive Design
State
- Angular Signals
- HttpClient
Testing
- Jasmine
- Karma
Backend
Spring Boot API with TMDB integration
The backend is a Spring Boot 3.5 application running on Java 21, organized into a strict layered architecture. It proxies requests to The Movie Database API and persists user data — playlists and saved movies — to PostgreSQL via JPA.
PostgreSQL is extended with pgvector for potential vector-based similarity search. Spring Actuator exposes health and metrics endpoints, which feed directly into the Prometheus scrape target.
TMDB API Integration
The backend acts as a typed proxy to The Movie Database — handling popular listings, name-based searches, full movie details, streaming provider lookup, and trailer retrieval. All external calls are encapsulated in a dedicated client layer.
Playlist CRUD
Full create, read, update, and delete operations for user playlists. Each playlist is stored in PostgreSQL as a PlaylistEntity with associated MovieEntity records, exposed through clean REST endpoints.
Layered Architecture
The codebase is organized into Controllers (HTTP handling), Services (business logic), Repositories (JPA data access), Entities (ORM mappings), and a Client layer (TMDB communication) — keeping each concern clearly separated.
PostgreSQL with pgvector
Core entities — movies, playlists, streaming providers, and video records — are stored relationally in PostgreSQL. The pgvector extension is included for potential future vector-based similarity search.
Health & Actuator Endpoints
Spring Actuator exposes application health checks and metrics endpoints. The metrics endpoint is scraped by Prometheus on a configured interval, feeding the Grafana dashboards.
Framework
- Spring Boot 3.5.3
- Java 21
- Maven
Database
- PostgreSQL
- pgvector
- JPA / Hibernate
External API
- TMDB API
- REST Client
Infra
- Docker
- Docker Compose
Observability
Production-grade monitoring and log aggregation
The application ships with a complete observability stack alongside it. Prometheus scrapes custom application metrics, Grafana visualizes them in real-time dashboards, and the ELK stack handles structured log aggregation — all orchestrated with Docker Compose.
This setup mirrors what a production-grade deployment would look like: any engineer can spin up the full environment with a single command and immediately have metrics, dashboards, and searchable logs available.
Prometheus Metrics
Custom Prometheus counters and timers track search operations, playlist actions, and API response latency. Spring Actuator exposes the metrics scrape endpoint that Prometheus polls on a fixed interval.
Grafana Dashboards
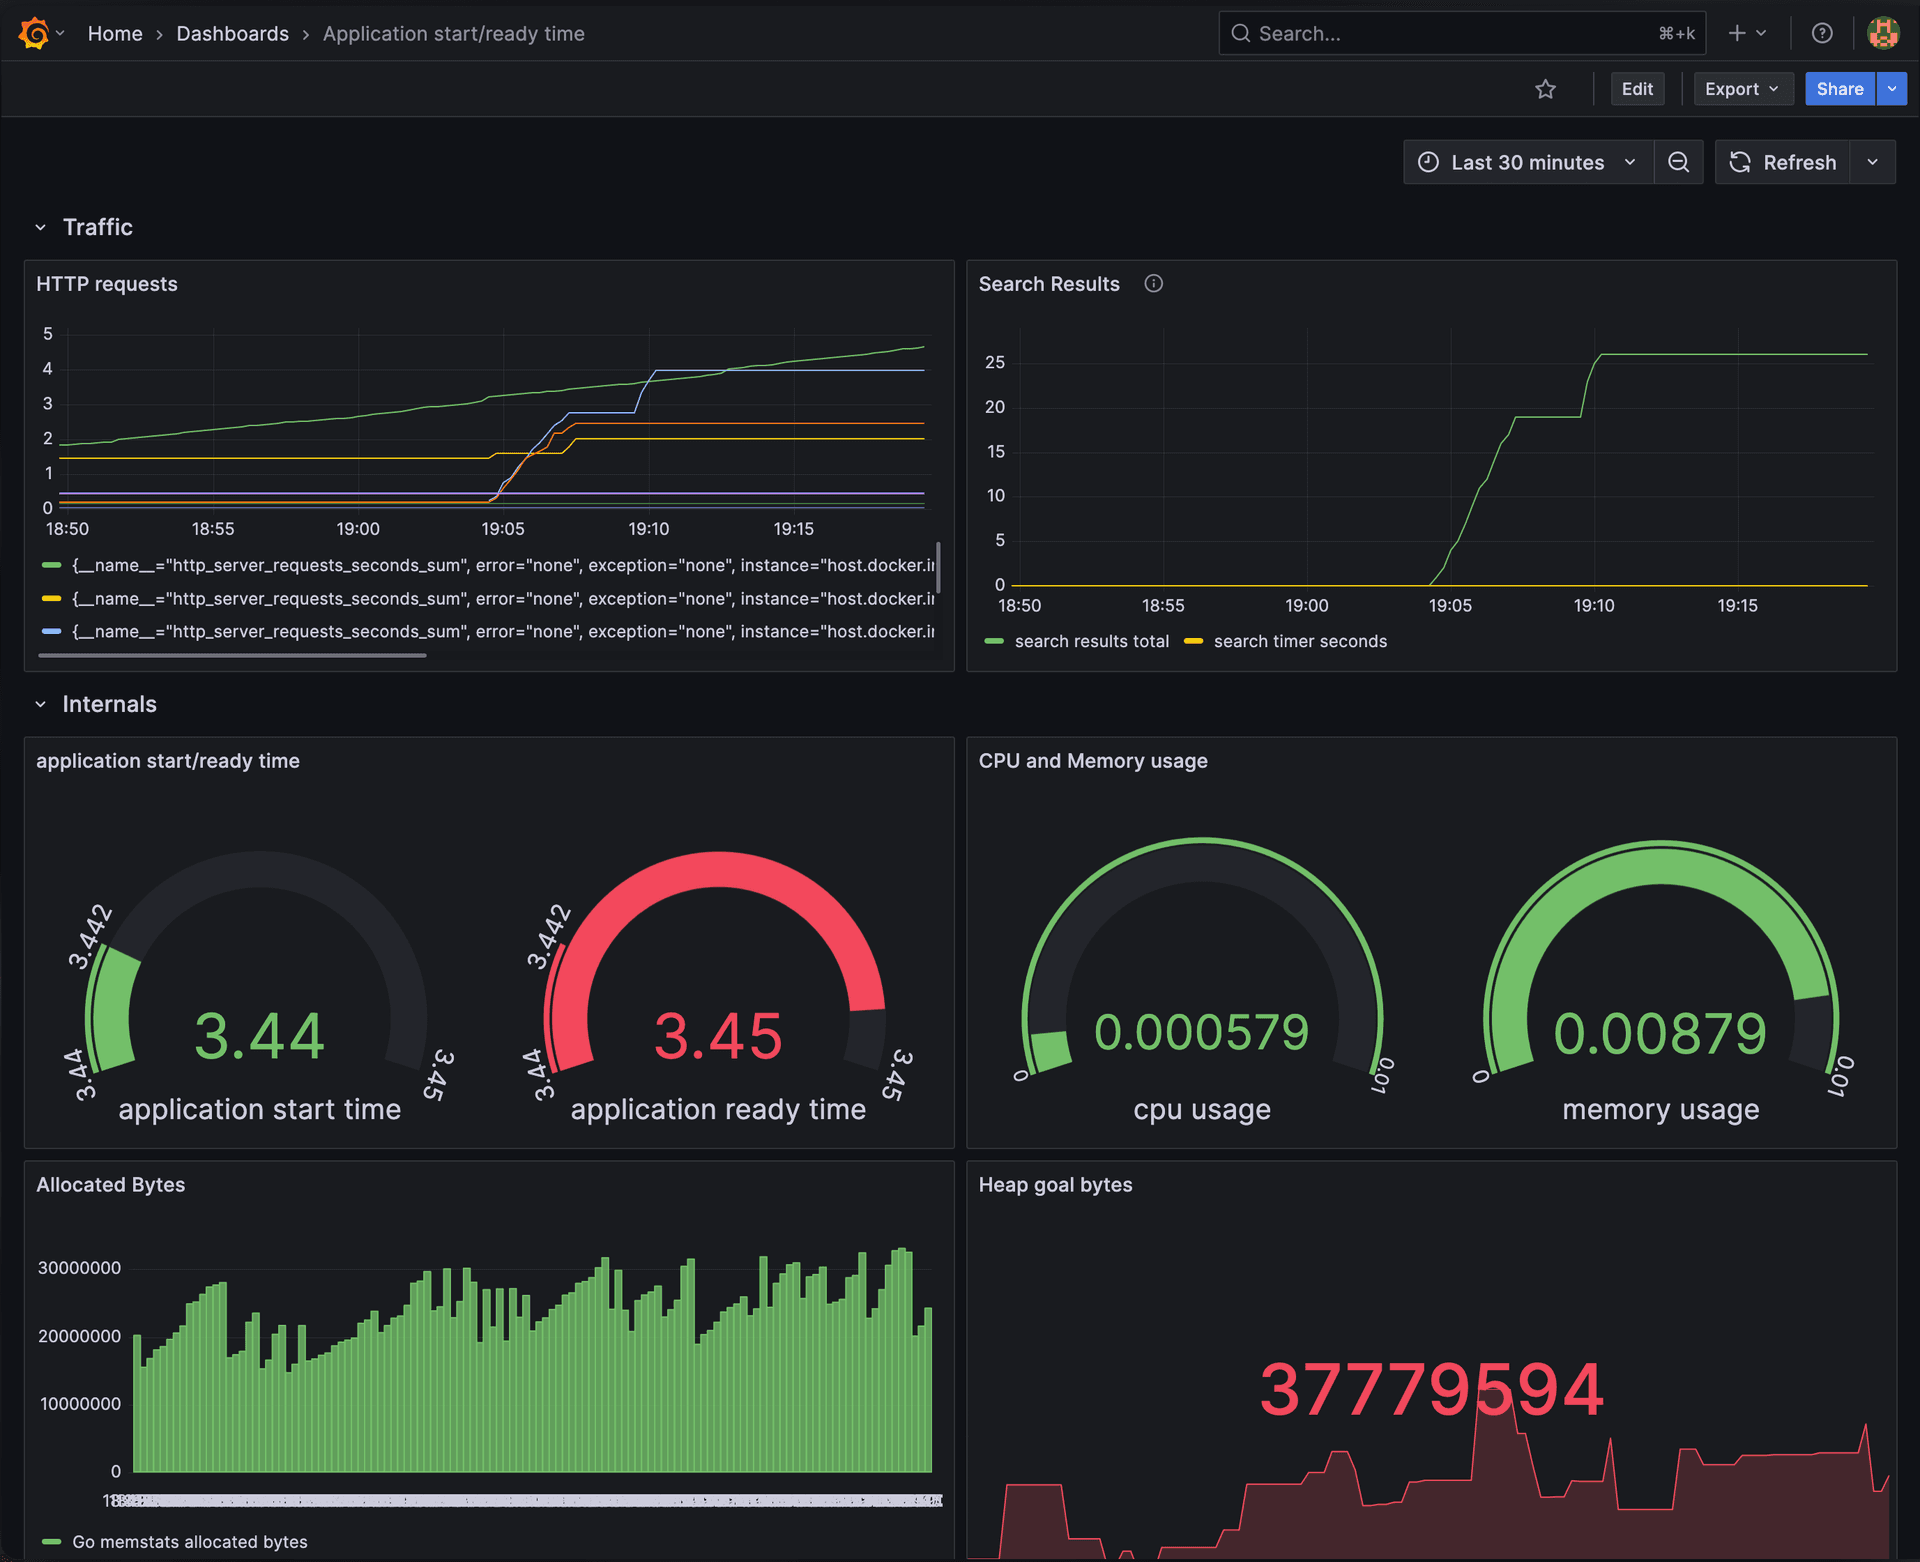
Pre-built Grafana dashboards visualize API request rates, response time percentiles, database connection pool health, and the custom business metrics — giving a live view of how the application behaves under use.
ELK Log Aggregation
Filebeat tails the Spring Boot log output and ships it to Elasticsearch. Kibana provides a searchable log viewer and dashboard surface, making it easy to trace requests and surface errors without SSH-ing into a container.
Docker Compose Orchestration
The entire stack — Spring Boot, PostgreSQL, Prometheus, Grafana, Elasticsearch, Kibana, and Filebeat — is wired together in a single Docker Compose file. One command brings up a fully instrumented local environment.
Metrics
- Prometheus
- Spring Actuator
Dashboards
- Grafana
Logging
- Elasticsearch
- Kibana
- Filebeat